
We already know how to use Hystrix to solve problems related to calling other services in a Microservice application. But another problem is how we can monitor, know which services are having problems, need to be resolved to take action immediately. Fortunately, Netflix also supports us with Hystrix Dashboard and Spring Cloud Netflix also has a wrapper for it. Hystrix Dashboard will show us which method of the current service is calling to another service, is there any problem? How is it in details? In this tutorial, let’s learn about Hystrix Dashboard from Spring Cloud Netflix!
I will use the example I did in the tutorial about Hystrix. Now I will add new Hystrix Dashboard dependency from Spring Cloud Netflix into this example project is as follows:
|
1 2 3 4 5 6 7 8 |
<dependency> <groupId>org.springframework.cloud</groupId> <artifactId>spring-cloud-starter-netflix-hystrix-dashboard</artifactId> </dependency> <dependency> <groupId>org.springframework.boot</groupId> <artifactId>spring-boot-starter-actuator</artifactId> </dependency> |
Here, as you can see, I have also added Actuator dependency. The purpose of this is to provide a URL that provides data for Hystrix Dashboard, created by default by Actuator.
First, to use the Hystrix Dashboard, you need to declare the @EnableHystrixDashboard annotation to the main class of the application as follows:
|
1 2 3 4 5 6 7 8 9 10 11 12 13 14 15 16 17 |
package com.huongdanjava.springcloudhystrix; import org.springframework.boot.SpringApplication; import org.springframework.boot.autoconfigure.SpringBootApplication; import org.springframework.cloud.client.circuitbreaker.EnableCircuitBreaker; import org.springframework.cloud.netflix.hystrix.dashboard.EnableHystrixDashboard; @SpringBootApplication @EnableCircuitBreaker @EnableHystrixDashboard public class SpringCloudHystrixApplication { public static void main(String[] args) { SpringApplication.run(SpringCloudHystrixApplication.class, args); } } |
Now, if you start the application and then request to the address “http://localhost:8180/hystrix/”, you will see the following result:
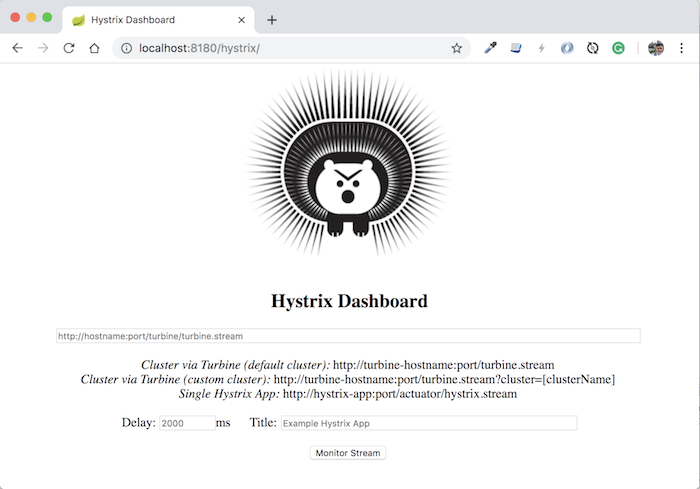
In the above window, as you can see, it has a box to enter the URL. This URL is the API that will provide the data for Hystrix Dashboard!
As I said above, this API will be created by default by Actuator so now we will configure the Actuator a little!
Because by default, Actuator only enables some APIs as follows:
so to enable API to provide data for Hystrix Dashboard, I will add the configuration to Actuator enable all the APIs it supports by declaring in application.properties file a property as follows:
|
1 |
management.endpoints.web.exposure.include=* |
You can see more of this tutorial!
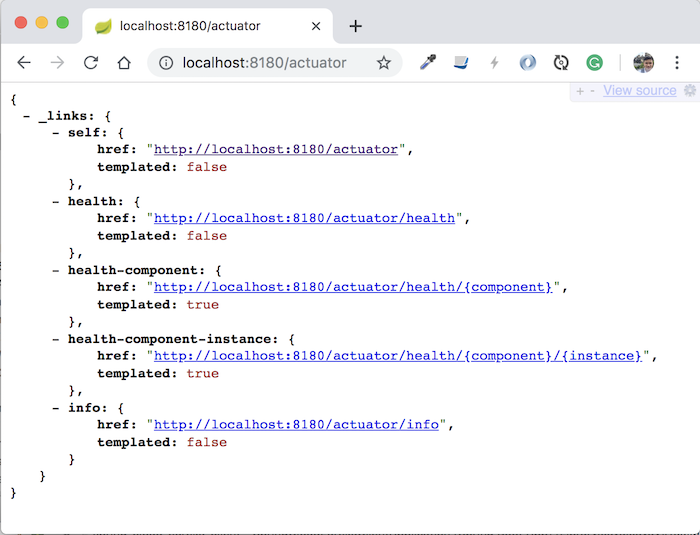
Now if you restart the application and then request to http://localhost:8180/actuator, you will see there is an API “http://localhost:8180/actuator/hystrix.stream”. This is the API that provides data for Hystrix Dashboard!
Go back to the Hystrix Dashboard window and enter this URL, then press the “Monitor Stream” button, you will see the following result:
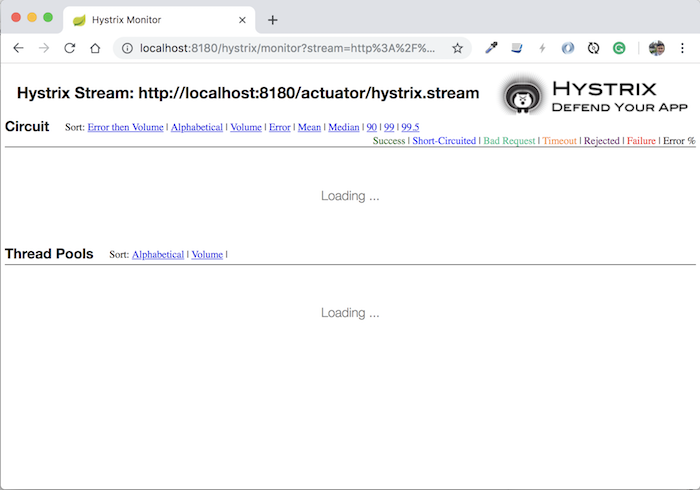
You only see the word “Loading …” above because there is no data to display that.
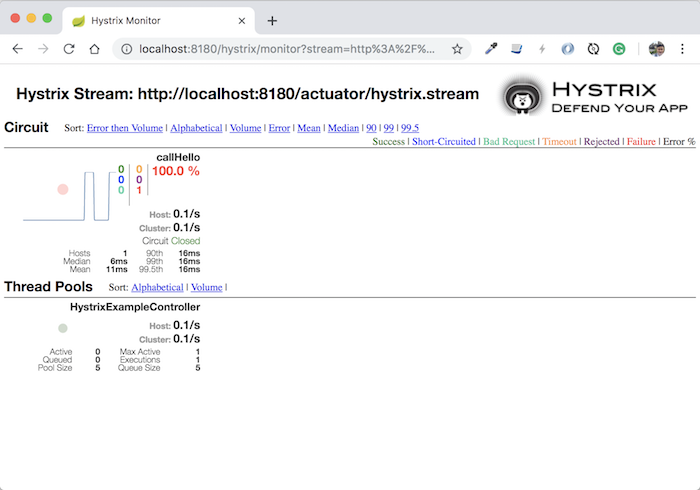
If now, you request to the address “http://localhost:8180/call-hello” and go back to the Hystrix Dashboard window, you’ll see the following result:
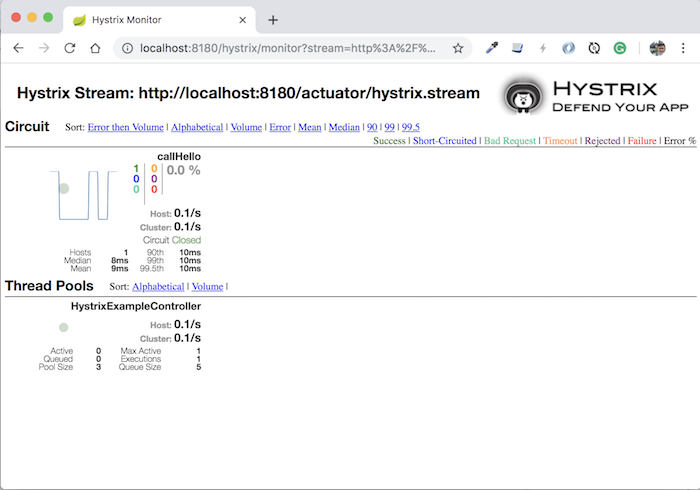
The service information we are calling in the callHello() method of this application has been displayed. There are 7 different information about a called service, displayed including Success, Short-Circuited, Bad Request, Timeout, Rejected, Failure and Error. Each information will have different colors to make it easier for you to grasp.
If I now turn off the “Eureka Client Example” service then request to the address “http://localhost:8180/call-hello” again, you will see Hystrix Dashboard display as follows:
Very intuitive, isn’t it? Look here you can know which service is having problems and need to take action!