
In the previous tutorial, I showed you how to add custom metrics using OpenTelemetry SDK metrics and I also used Logging exporter to log this metrics information to the console. In this tutorial, I will show you how to integrate Prometheus with OpenTelemetry using Prometheus exporter to display these metrics information with Prometheus!
I will reuse the example in the previous tutorial, but instead of using the Logger exporter, I will configure it to use the Prometheus exporter as follows:
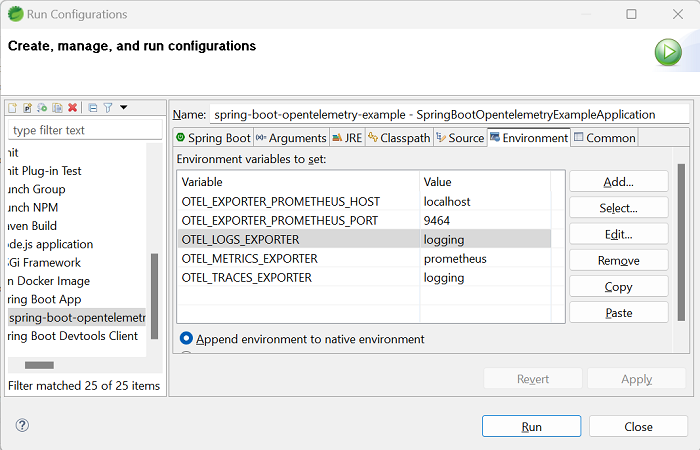
As you can see, we will be using Prometheus-specific environment variables
- OTEL_EXPORTER_PROMETHEUS_PORT
- and OTEL_EXPORTER_PROMETHEUS_HOST
- in addition to the variable OTEL_METRICS_EXPORTER with the value as “prometheus” to specify for the Prometheus exporter.
You also need to declare the environment variables related to OTEL_TRACES_EXPORTER and OTEL_LOGS_EXPORTER using Logging Exporter as I did above for example. Since Prometheus only works with metrics.
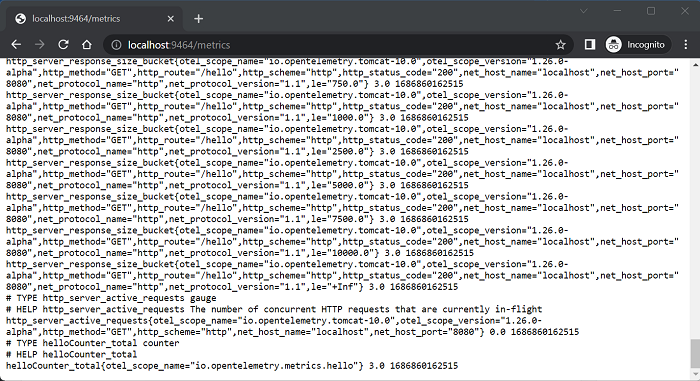
With this configuration, OpenTelemetry will export metric information using a local server running on port 9464. Prometheus needs to connect to the server with this port to collect metric information.
Now, if you run the application, request to the address http://localhost:8080/hello, 3 times, and then go to the address http://localhost:9464/metrics, you will see the result as follows:
To specify for Prometheus to connect to the server with this port, in the Prometheus configuration file, you need to configure the scrape_configs section with a job with a static_configs target that points to the server that OpenTelemetry has up and running above. My Prometheus server is installed using Docker Compose, to be able to connect to the host machine’s address, I will configure the scrap_configs section as follows:
|
1 2 3 4 5 6 7 8 9 10 11 |
# A scrape configuration containing exactly one endpoint to scrape: # Here it's Prometheus itself. scrape_configs: # The job name is added as a label `job=<job_name>` to any timeseries scraped from this config. - job_name: "prometheus" # metrics_path defaults to '/metrics' # scheme defaults to 'http'. static_configs: - targets: ["host.docker.internal:9464"] |
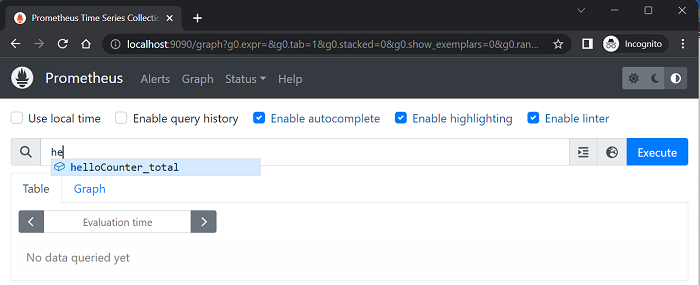
Now, if you go to Prometheus’s page at http://localhost:9090/, enter the word “hello” in the Expression box, you will see the “helloCounter_total” metric displayed as follows:
Select this metric and then click Execute, you will see the following results:
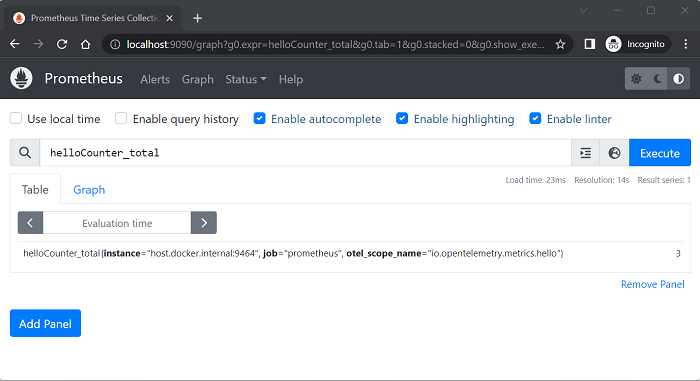
As you can see, the custom metric information that I defined in the previous tutorial has been collected and can be searched using Prometheus!


Abhi
I can remove the OTEL_EXPORTER_PROMETHEUS_HOST variable in the local environment right? But what should be the value of host in a production environment? Should I provide the IP address of my machine ? Or can I remove that variable just like in the local environment?
In either case, what changes I have to make to the scrape_config section?
Khanh Nguyen
I already replied to your email, please let me know if there is any problem.