
Prometheus is an open-source monitoring application. It will collect and store metrics of the running application over time. To install Prometheus using Docker Compose, please select the version you want to install on the Prometheus Docker Hub page https://hub.docker.com/r/prom/prometheus first. Then use the docker-compose.yml file with the following content to install it:
|
1 2 3 4 5 6 7 8 9 10 |
services: prometheus: image: prom/prometheus:v3.6.0 healthcheck: test: [ "CMD-SHELL", "wget --quiet --tries=1 --spider http://localhost:9090/-/healthy || exit 1" ] interval: 5s timeout: 1s retries: 10 ports: - 9090:9090 |
By default, Prometheus runs on port 9090, guys! To check health, we will call Prometheus’s endpoint http://localhost:9090/-/healthy, as you can see!
Please run the command “docker compose up” in the directory containing this docker-compose.yml file, you will see the following results:
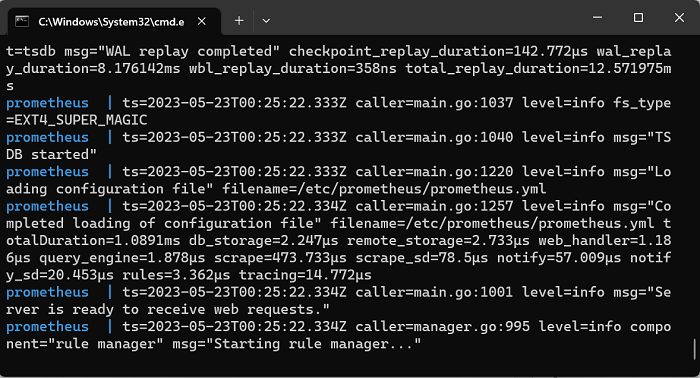
Looking at the above log messages, you can see that, by default, Prometheus is using a configuration file located at “/etc/prometheus/prometheus.yml”. The contents of this file are as follows:
|
1 2 3 4 5 6 7 8 9 10 11 12 13 14 15 16 17 18 19 20 21 22 23 24 25 26 27 28 29 30 31 32 |
# my global config global: scrape_interval: 15s # Set the scrape interval to every 15 seconds. Default is every 1 minute. evaluation_interval: 15s # Evaluate rules every 15 seconds. The default is every 1 minute. # scrape_timeout is set to the global default (10s). # Alertmanager configuration alerting: alertmanagers: - static_configs: - targets: # - alertmanager:9093 # Load rules once and periodically evaluate them according to the global 'evaluation_interval'. rule_files: # - "first_rules.yml" # - "second_rules.yml" # A scrape configuration containing exactly one endpoint to scrape: # Here it's Prometheus itself. scrape_configs: # The job name is added as a label `job=<job_name>` to any timeseries scraped from this config. - job_name: "prometheus" # metrics_path defaults to '/metrics' # scheme defaults to 'http'. static_configs: - targets: ["localhost:9090"] # The label name is added as a label `label_name=<label_value>` to any timeseries scraped from this config. labels: app: "prometheus" |
To be able to edit the content of this configuration file conveniently, you can create a new file prometheus.yml with the above content, and store it in a certain folder. Then edit the contents of the above docker-compose.yaml file to mount this newly created prometheus.yml file pointing to the path “/etc/prometheus/prometheus.yml” inside the container. My example is as follows:
|
1 2 3 4 5 6 7 8 9 10 11 12 |
services: prometheus: image: prom/prometheus:v3.6.0 healthcheck: test: [ "CMD-SHELL", "wget --quiet --tries=1 --spider http://localhost:9090/-/healthy || exit 1" ] interval: 5s timeout: 1s retries: 10 volumes: - ./prometheus.yml:/etc/prometheus/prometheus.yml:ro ports: - 9090:9090 |
Now, rerun “docker compose up” and go to the address http://localhost:9090, you will see the following results:
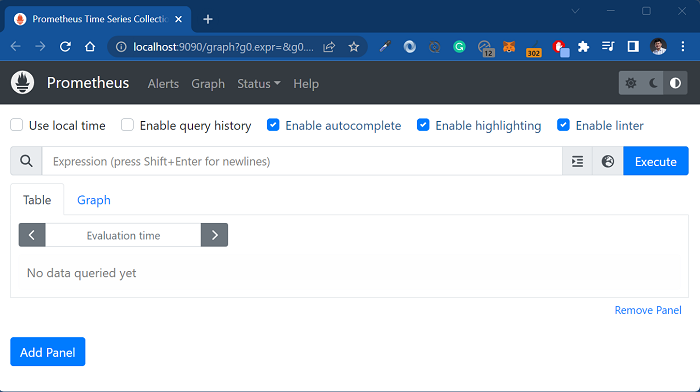
So we have successfully installed Prometheus!