Grafana is an open-source tool for data visualization and monitoring platform. In this tutorial, I show you how to install this tool using Docker Compose!
First, go to Grafana’s Docker Hub page https://hub.docker.com/r/grafana/grafana to find the version you want to install. I will install the latest version.
Grafana will run on port 3000 by default, so I will write a docker-compose.yml file with the following content to install Grafana:
|
1 2 3 4 5 6 7 8 9 10 |
services: grafana: image: grafana/grafana:12 healthcheck: test: [ "CMD-SHELL", "curl -f http://localhost:3000/api/health || exit 1" ] interval: 5s timeout: 1s retries: 10 ports: - 3000:3000 |
When Grafana runs, it will expose the endpoint http://localhost:3000/api/health, which helps us to health check!
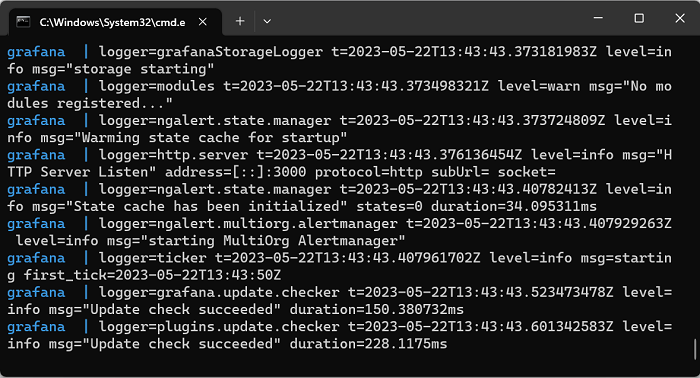
If now, you run the command “docker compose up” in the directory containing this docker-compose.yml file, you will see the following results:

So we have successfully installed Grafana using Docker Compose already!
To access the Grafana Dashboard, go to http://localhost:3000/. Its results are as follows:

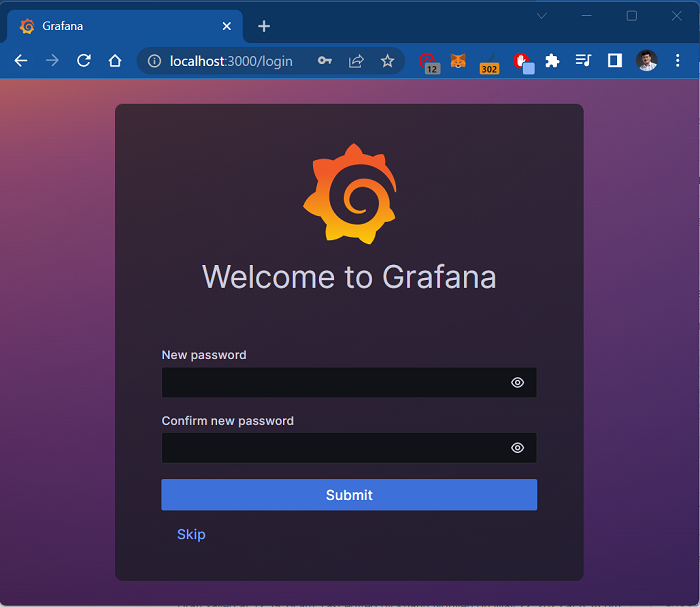
The default username and password are admin/admin, guys! After you log in using this information, Grafana will ask if you want to change this default password:

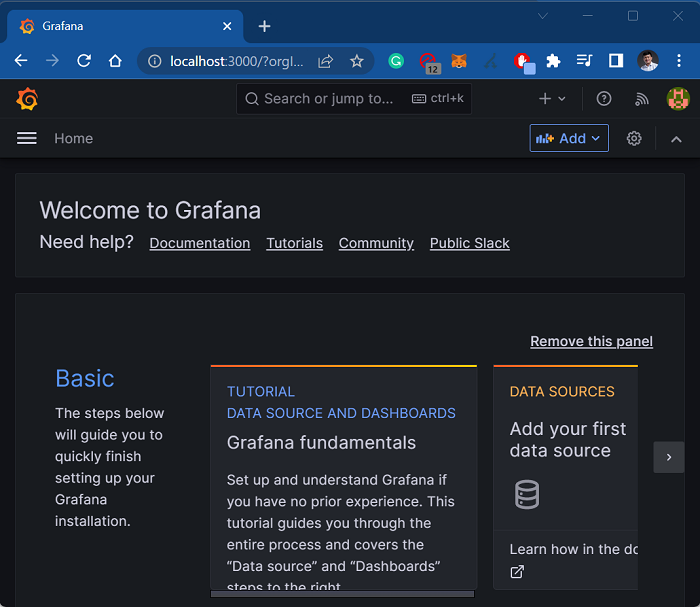
Please change this password if you want! Otherwise, you can click Skip, the result will be as follows:


