As I introduced Spring Boot’s Actuator tool in the previous tutorial, it allows us to monitor our application in a production environment. You can integrate Spring Boot Actuator with Prometheus to query application-related information. How do we do that? Let’s find out together in this tutorial!
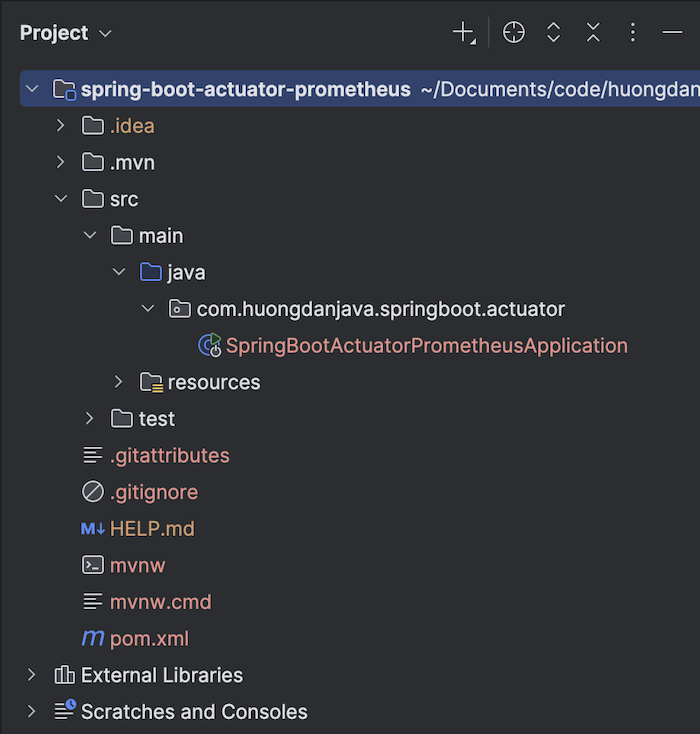
First, I will create a new Spring Boot project with Actuator, Web, and Prometheus dependencies as an example:
Check the project’s pom.xml file, and you’ll find a Micrometer dependency as follows:
|
1 2 3 4 5 |
<dependency> <groupId>io.micrometer</groupId> <artifactId>micrometer-registry-prometheus</artifactId> <scope>runtime</scope> </dependency> |
This dependency is used to bridge and format the micrometer’s metrics information according to the Prometheus format. This allows Prometheus to understand and query this information using Prometheus.
Enable all Actuator endpoints using properties:
|
1 2 3 4 5 |
management: endpoints: web: exposure: include: '*' |
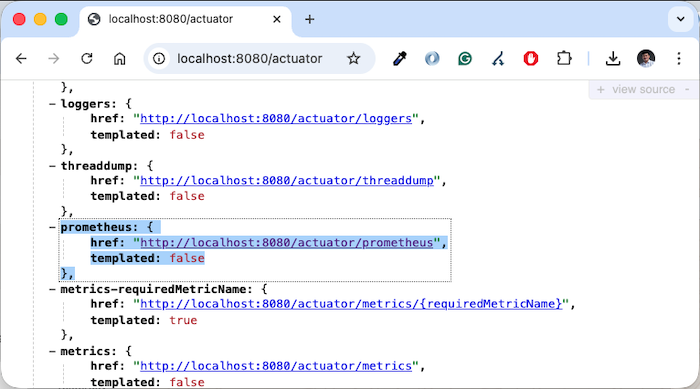
go to the address http://localhost:8080/actuator, check the endpoint information, and you will see an endpoint related to Prometheus as follows:
Go to the endpoint http://localhost:8080/actuator/prometheus, and you will see the application’s metrics exposed:
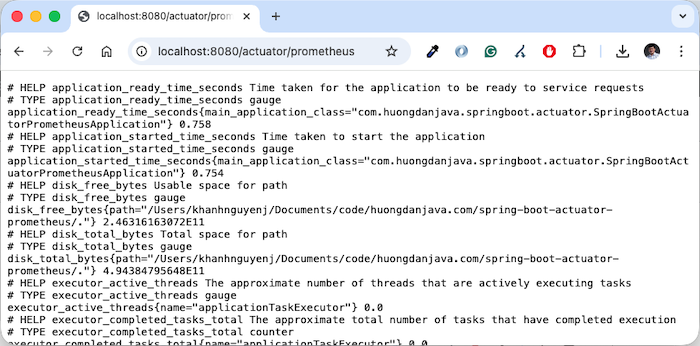
and we can configure Prometheus to capture this information!
I’ve already shown you how to install Prometheus using Docker Compose in the previous tutorial. To enable Prometheus to capture the information exposed by the Actuator above, add a scape_config to your Prometheus configuration file as follows:
|
1 2 3 4 5 6 |
scrape_configs: - job_name: 'actuator' scrape_interval: 15s metrics_path: '/actuator/prometheus' static_configs: - targets: [ 'host.docker.internal:8080' ] |
With the above configuration, I set the job name to “actuator”. Every 15 seconds, Prometheus will capture information using the metric_path ‘/actuator/prometheus’. Since I’m running the example application on my local machine and Prometheus is running using Docker Compose, I configured the target to use the host name “host.docker.internal” with port 8080.
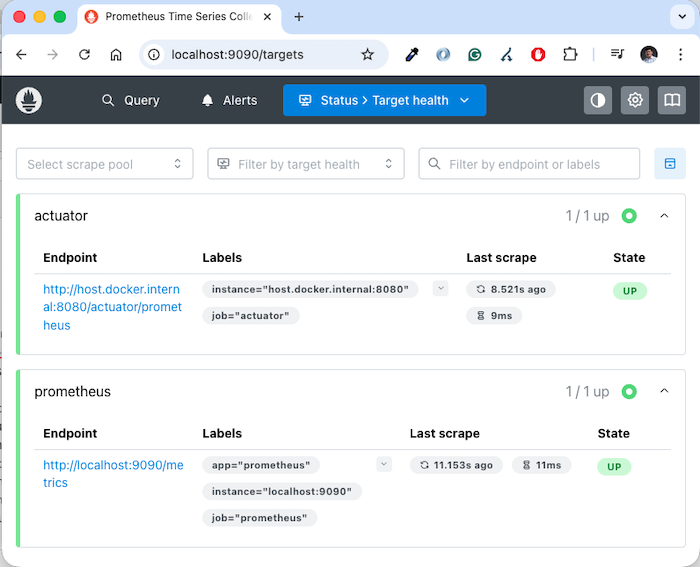
Running Prometheus again, you will see the information of the example application in the Prometheus Target section as follows:
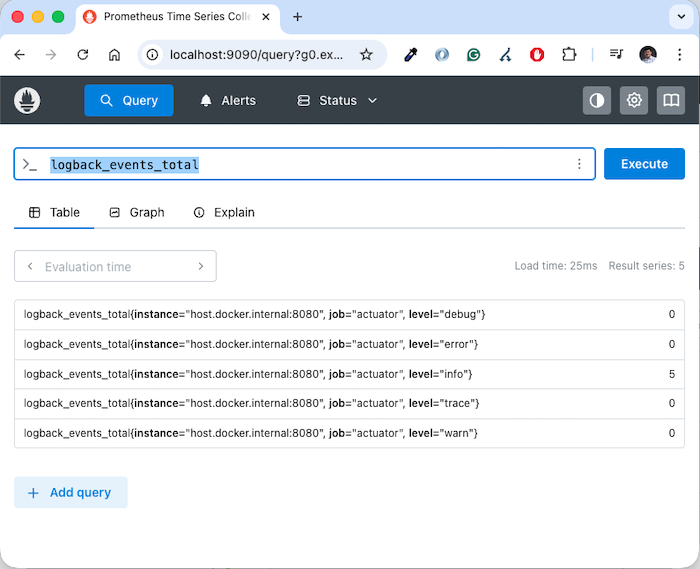
If you try querying “logback_events_total” using Prometheus, you will see the following result: